The Timeline panel in Query Monitor
The Timeline panel provides a visual overview of the events that occur during a page load. Database queries, HTTP API requests, PHP errors, timings, logs, and other notable events are all plotted on a horizontal timeline so you can see when each one happened, how long it took, and how they relate to each other.
Where the other panels answer "what happened?", the Timeline answers "when did it happen, and in what order?". This makes it the quickest way to see where the time during a page load is actually being spent.
Each event is colour-coded by category. Only the categories that have events during the current request are shown.
Reading the timeline
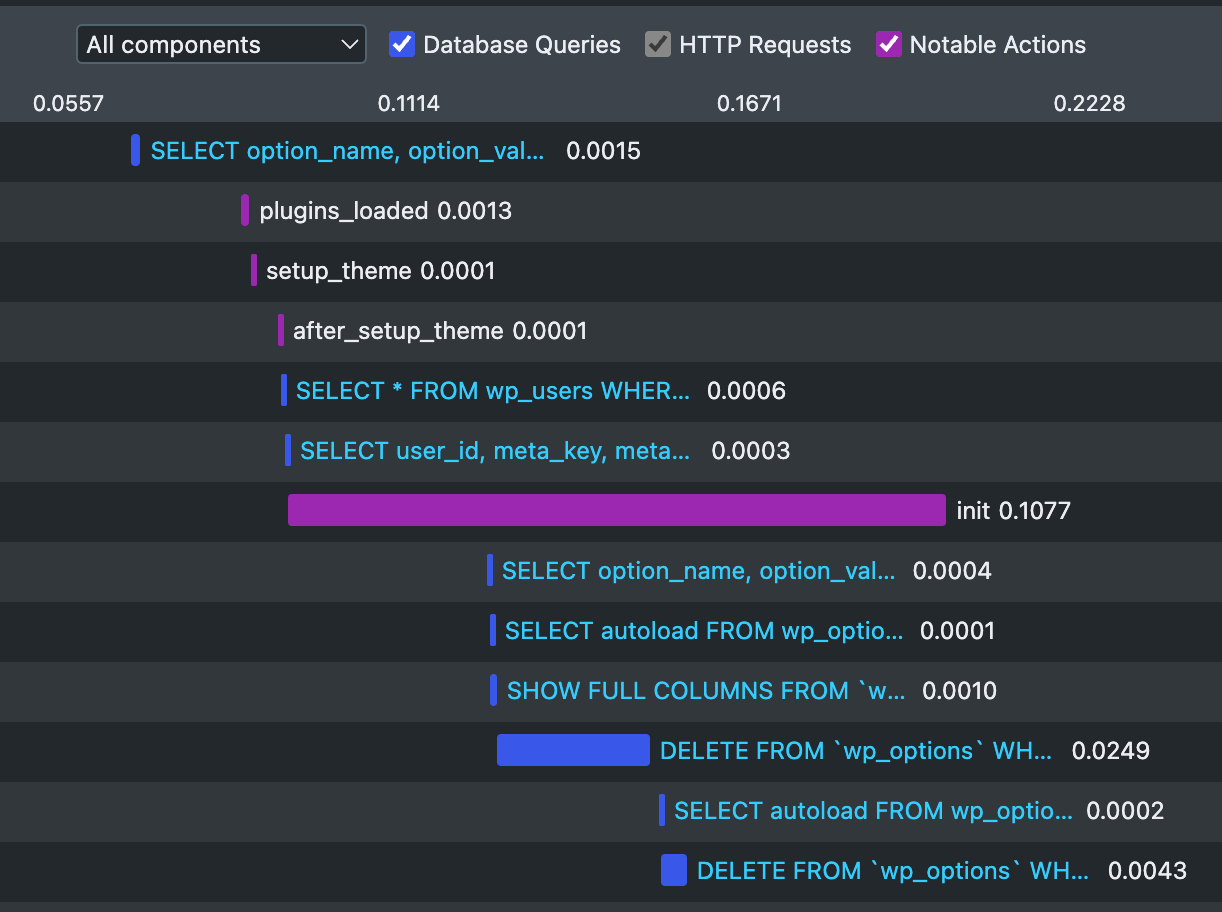
The horizontal axis represents time, from the start of the request to the end.
- An event with a duration is drawn as a bar whose position and length marks when it started and how long it took.
- An event that's a point in time is shown as a short bar.
Clicking the label on most events jumps you to the corresponding row in its related panel, so you can see the full details.
Use the dropdown and checkboxes at the top of the timeline to filter by component and category. Helpful when you're debugging or investigating something specific.
Using the timeline to debug a slow page
The timeline is particularly useful for spotting patterns that aren't obvious from the individual panels:
- Long-runnning operations - Long bars indicate areas to focus on if you're looking to reduce the page generation time.
- Sequential operations - A series of bars laid out one after another, rather than overlapping, indicates work that's happening in series and could be a bottleneck.
- Clusters of activity - A dense group of events in one part of the timeline shows where the bulk of the work is concentrated, although be aware there are naturally clusters in places such as the
inithook and template file rendering.