Debugging user capability checks with Query Monitor
Query Monitor can log all of the user capability checks that are performed during a page load of WordPress. It will show you the result of the capability check, information about the user, and where the check was called from. This can be very helpful when testing functionality on your site for users who are not Administrators.
Step 1: Enable the panel
The user capabilities panel is not enabled by default because it can cause performance issues on sites that perform a large number of user capability checks. To enable this panel, add the following code to your wp-config.php file:
define( 'QM_ENABLE_CAPS_PANEL', true );Step 2: Authenticate
From the Settings panel in Query Monitor (click the cog next to the Close icon), click the "Set authentication cookie" button. This will allow you to view Query Monitor output while you're logged in as a different user.
Step 3: Log in as another user
Log in to your site using a user account with a lower level role, for example an Editor or Author. To save yourself time you can use the User Switching plugin to instantly swap between user accounts in WordPress at the click of a button.
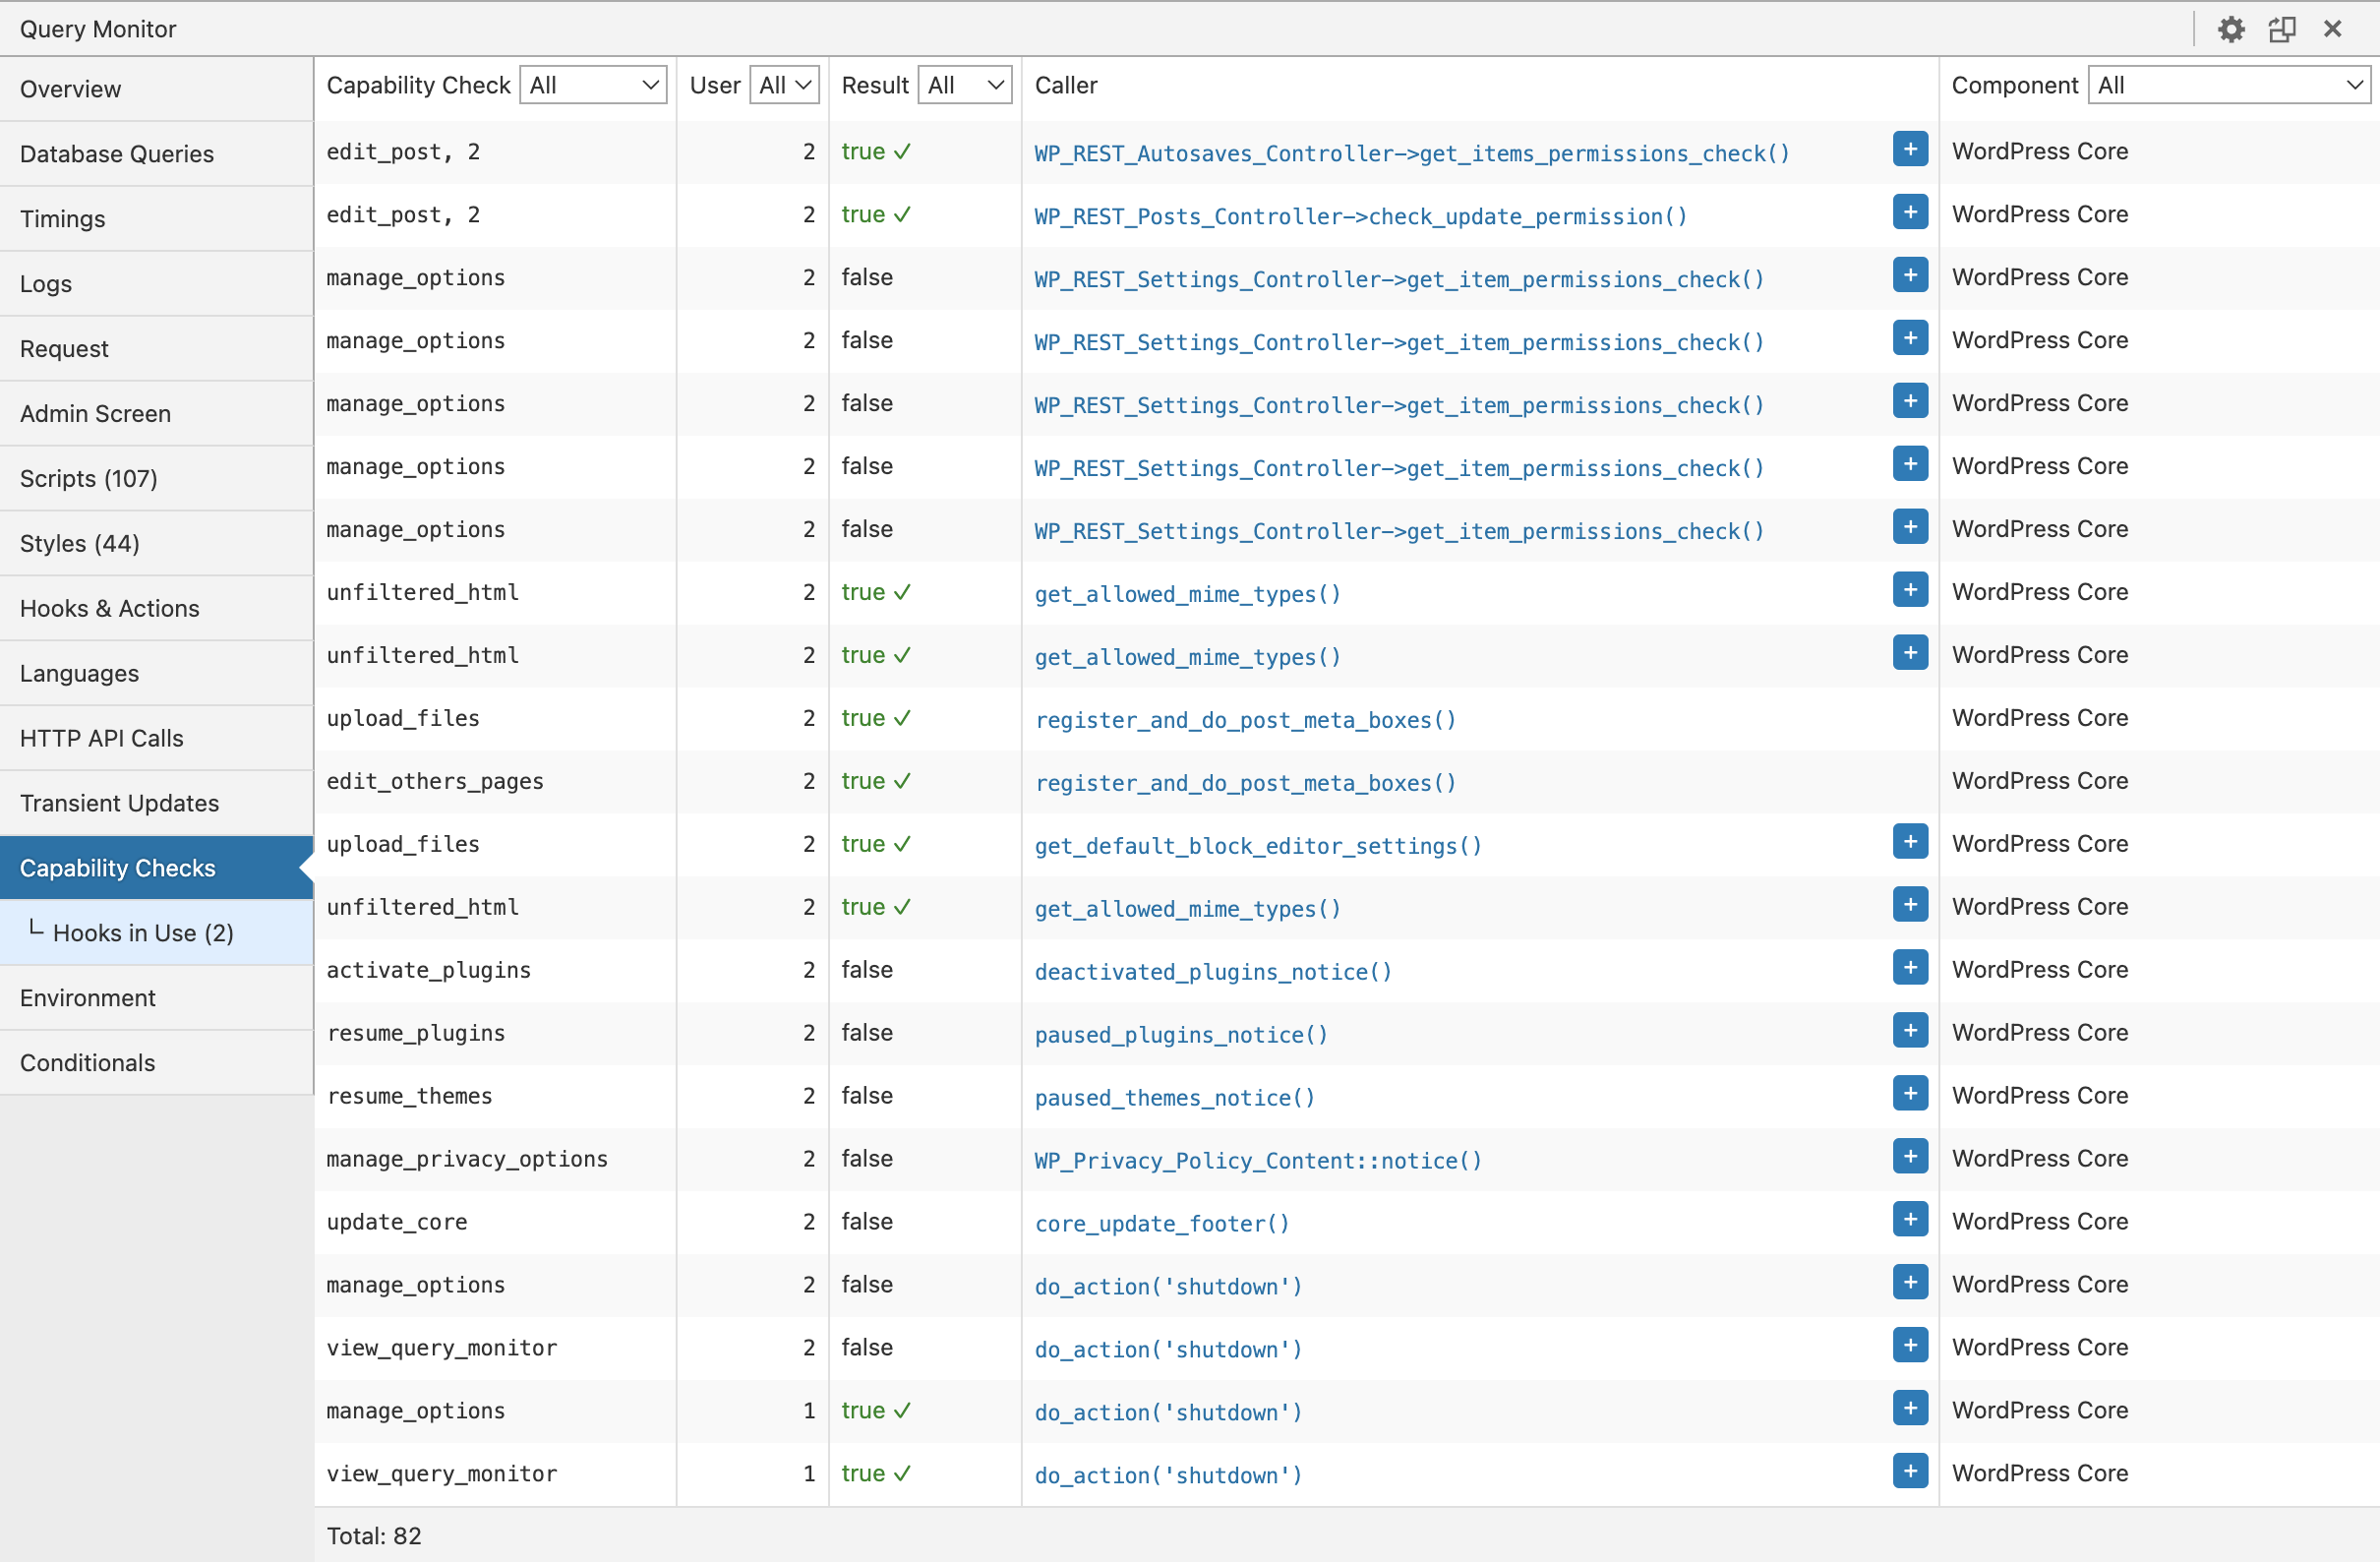
Step 4: View the Capability Checks panel
You're now able to test the functionality on your site as a lower level user and the "Capability Checks" panel in Query Monitor will show you all the capability checks performed on the page, along with the result, the caller, and the component. No more guesswork!