Debugging blocks with Query Monitor
The Blocks panel in Query Monitor lists all of the blocks on the current page, along with their attributes and other debugging information. Nested blocks (for example for groups or columns) are fully supported.
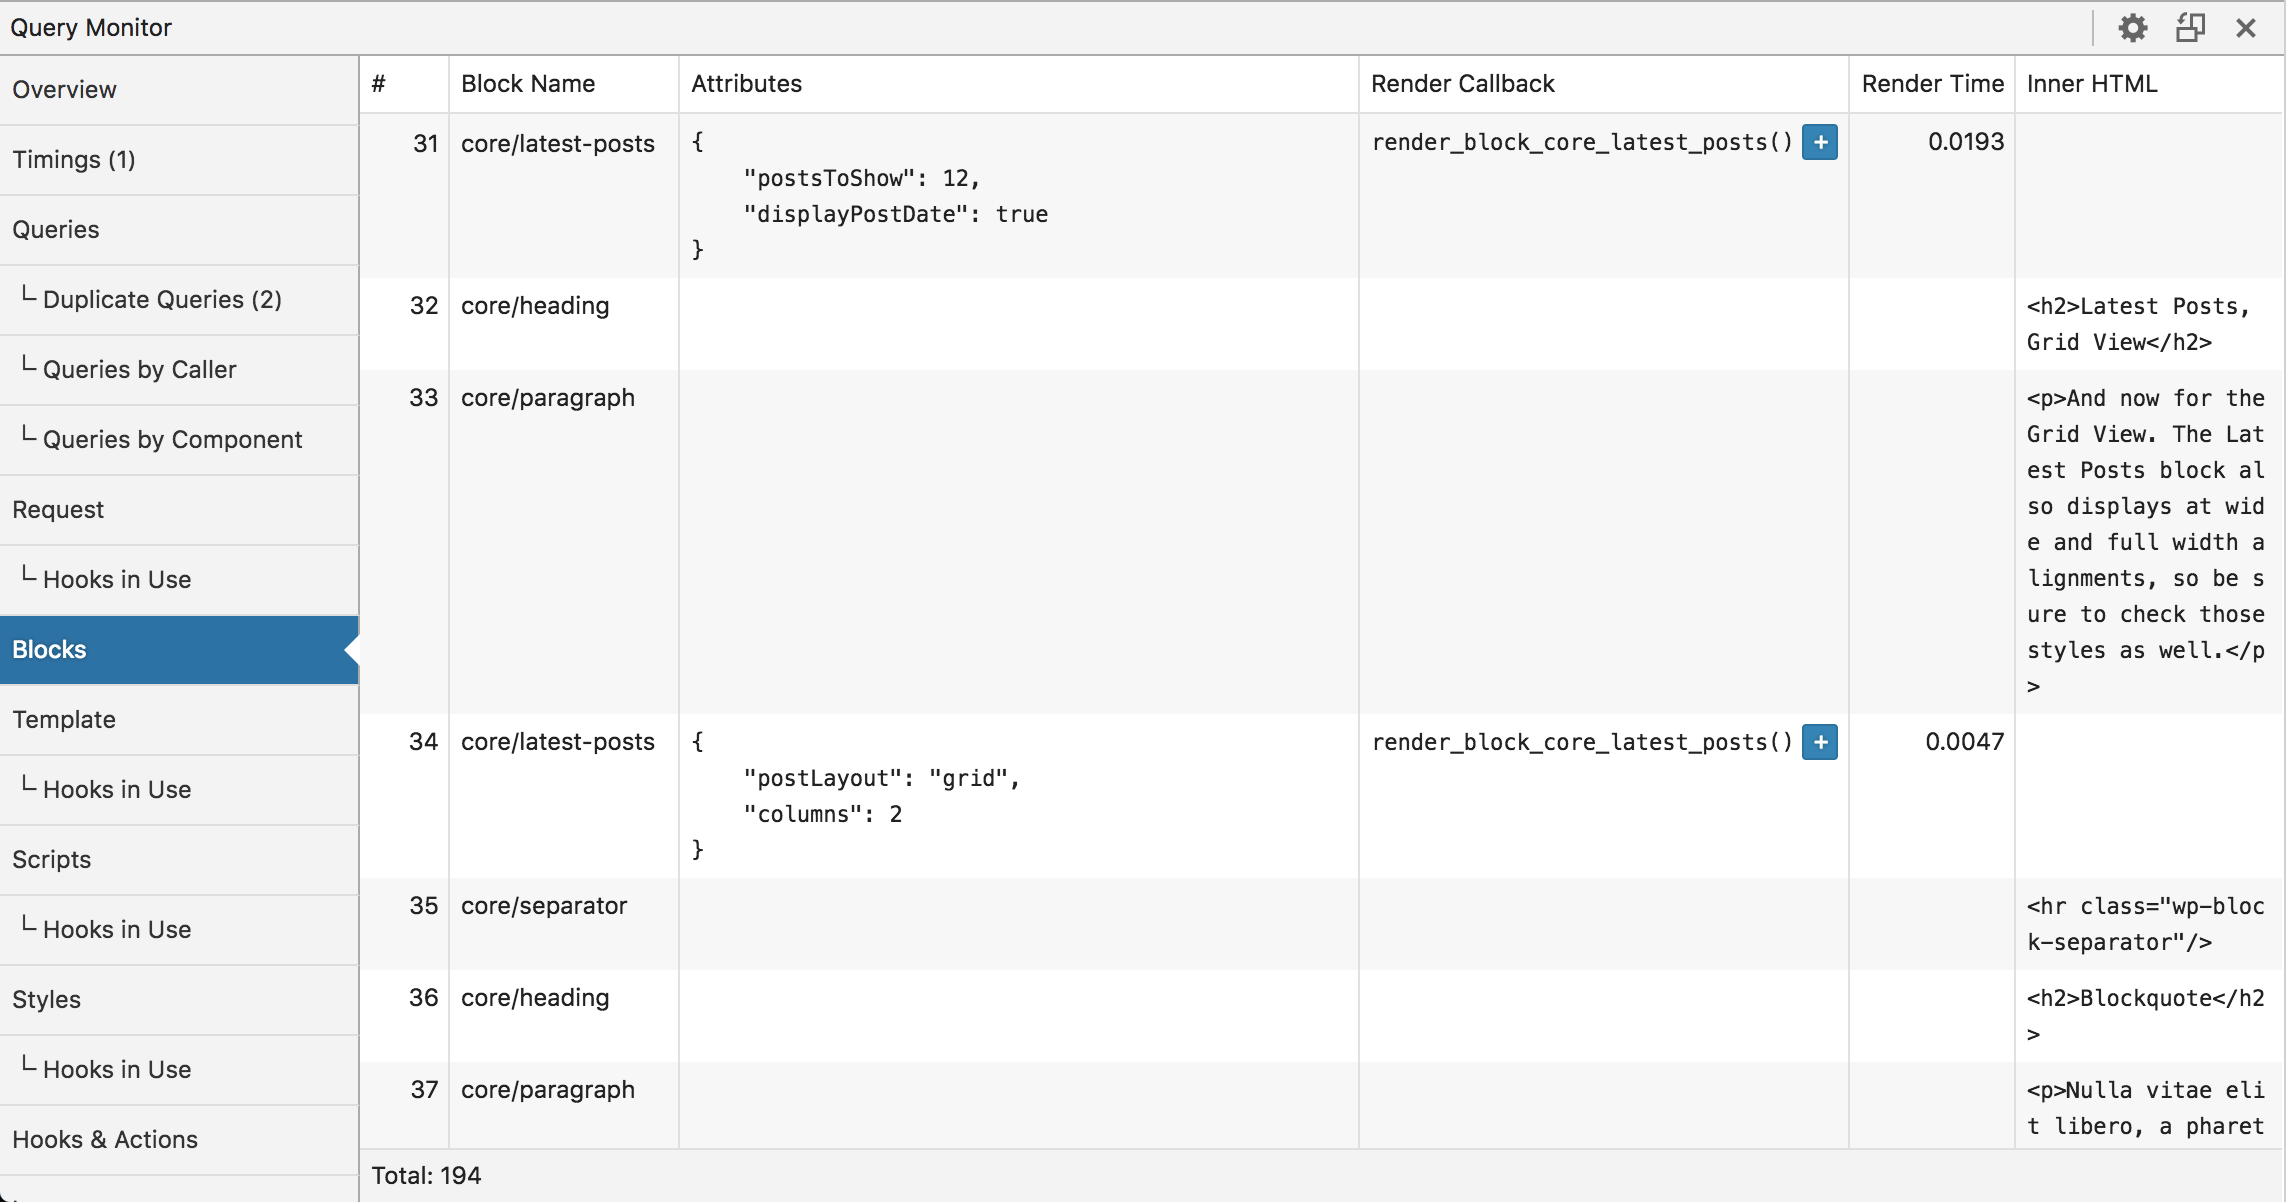
If you're developing dynamic blocks, the block render callback and render timing information will help you keep an eye on performance that can otherwise be difficult to measure.
Nested blocks are fully supported and display hierarchical numbering so you can see exactly how the block tree is structured. This is helpful when working with layouts using Group, Columns, or custom container blocks.
When is this useful?
- Verifying that your block attributes are being saved and passed through correctly
- Debugging nested block structures that aren't rendering as expected
- Identifying slow dynamic blocks that are contributing to page generation time
- Checking which render callback is being used for a dynamic block