Related hooks with filters or actions attached
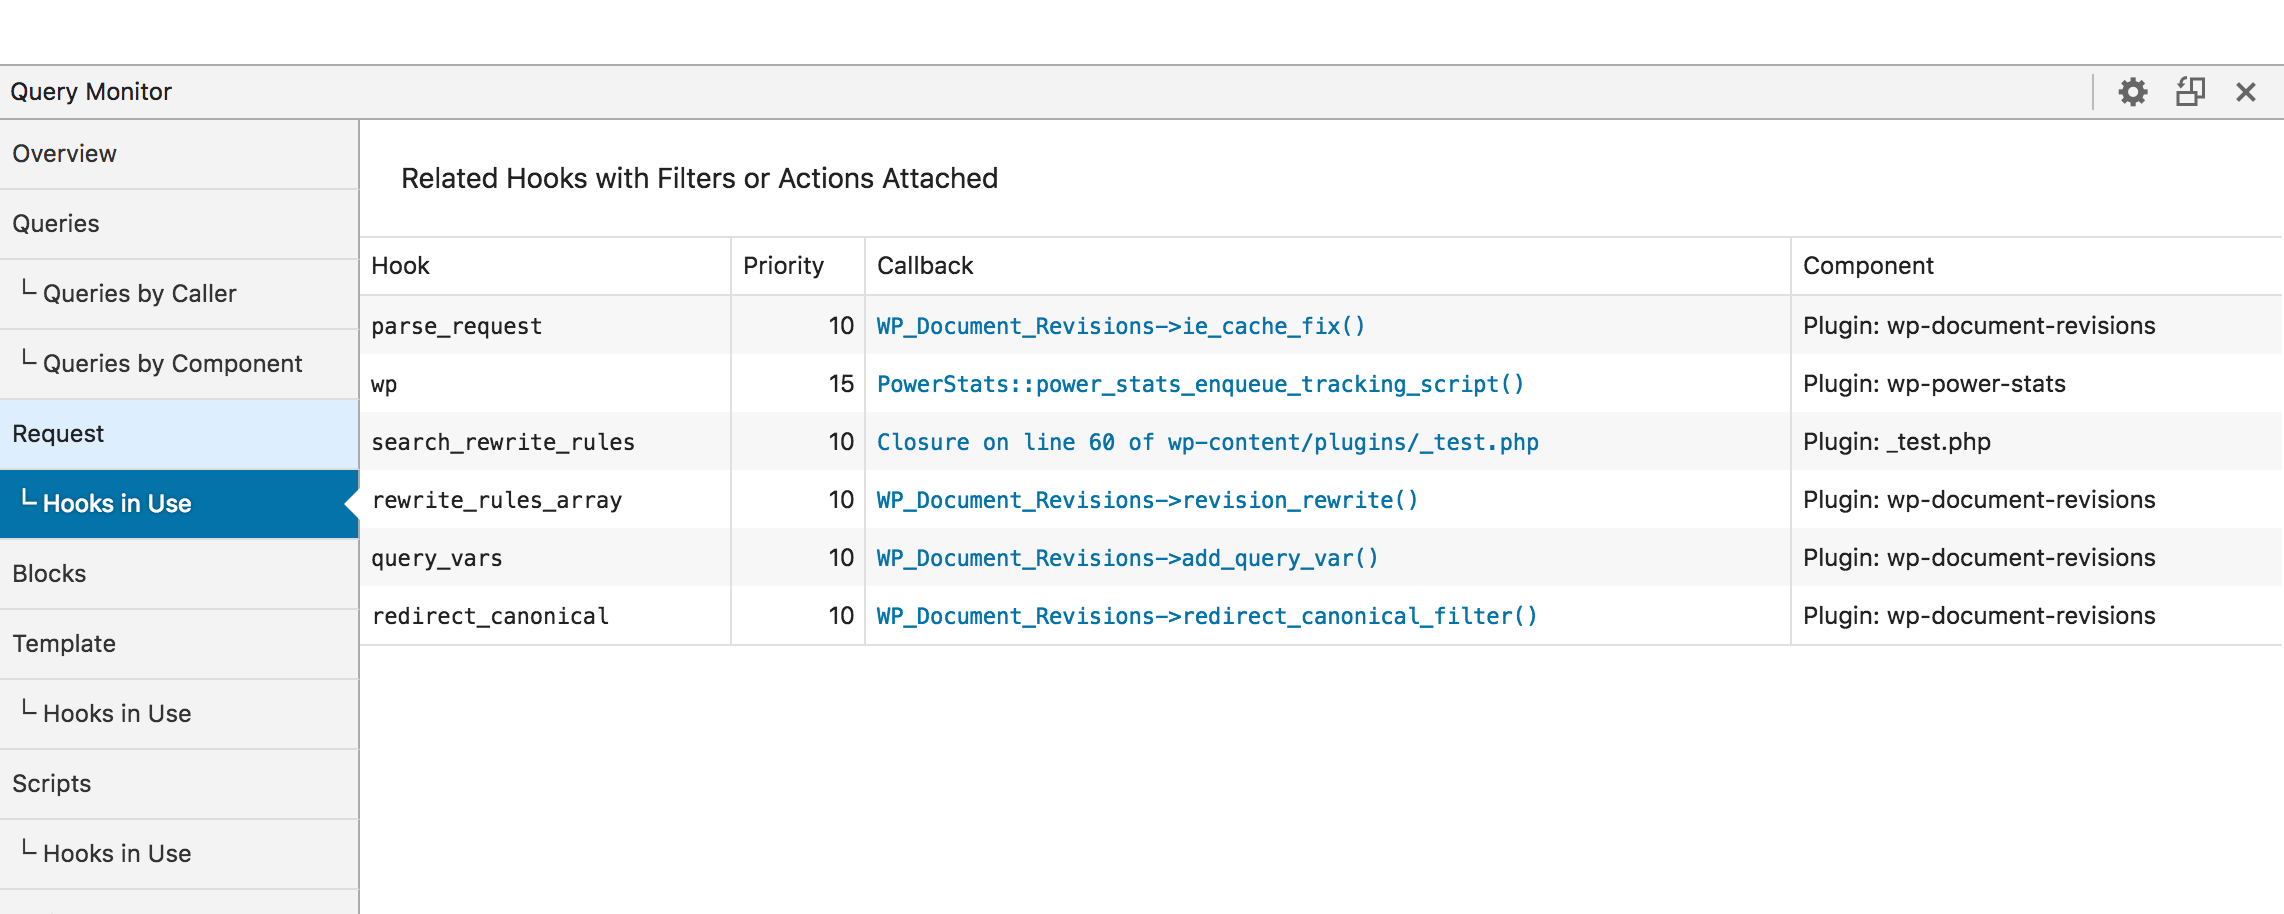
Many of the panels in Query Monitor include a sub-menu which lists related hooks where filters or actions are attached to them. This can greatly reduce the amount of time you spend trying to find out what's making changes to certain behaviour on your site.
I've found this to be particularly helpful on the Request panel, which tracks hooks related to rewrite rules, query parsing, request handling, query vars, and more.
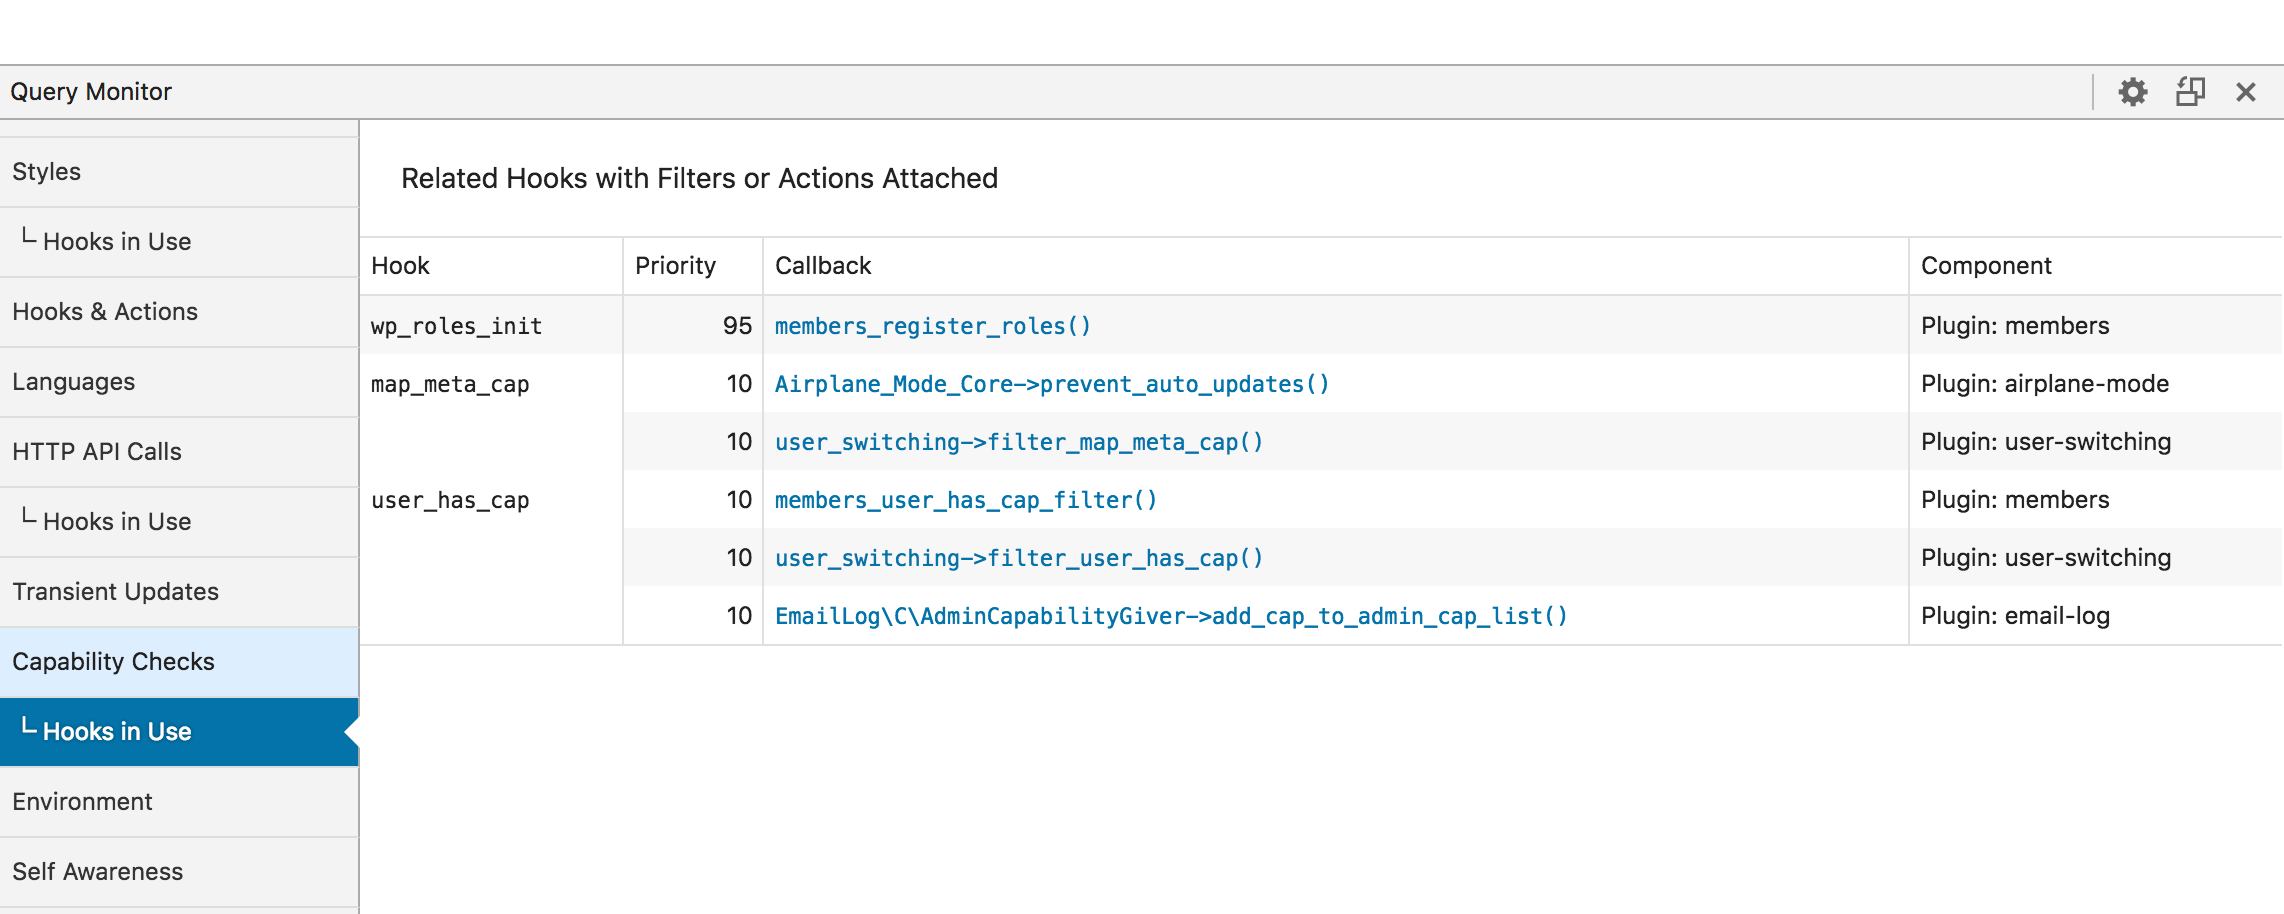
It's also very useful for figuring out what's making changes to user role and capability handling on your site:
Some panels track certain option names too, which means all the filters related to that option get automatically tracked. For example, you'll be able to see if something is hooked onto the pre_option_stylesheet filter on the Template panel, or the site_option_WPLANG filter on the Languages panel.
Not all of the panels are tracking related hooks yet. I'll continue expanding and improving this feature in future releases of QM, including adding a way to expose all of the hooks that each panel is tracking, regardless of whether filters or actions are attached to them.