Profiling and logging with Query Monitor
Query Monitor allows developers to profile the running time and memory usage of a piece of code on your WordPress site and to log debugging messages to the Query Monitor interface.
Let's take a look at profiling and logging in detail.
Profiling
Basic profiling can be performed and displayed in the Timings panel in Query Monitor using actions in your code:
// Start the 'foo' timer:
do_action( 'qm/start', 'foo' );

// Run some code
my_potentially_slow_function();

// Stop the 'foo' timer:
do_action( 'qm/stop', 'foo' );
// Start the 'foo' timer:
do_action( 'qm/start', 'foo' );
// Run some code
my_potentially_slow_function();
// Stop the 'foo' timer:
do_action( 'qm/stop', 'foo' );The time taken and approximate memory usage used between the qm/start and qm/stop actions for the given function name will be recorded and shown in the Timings panel. Timers can be nested, although be aware that this reduces the accuracy of the memory usage calculations.
Timers can also make use of laps with the qm/lap action:
// Start the 'bar' timer:
do_action( 'qm/start', 'bar' );

// Iterate over some data:
foreach ( range( 1, 10 ) as $i ) {
    my_potentially_slow_function( $i );
    do_action( 'qm/lap', 'bar' );
}

// Stop the 'bar' timer:
do_action( 'qm/stop', 'bar' );
// Start the 'bar' timer:
do_action( 'qm/start', 'bar' );
// Iterate over some data:
foreach ( range( 1, 10 ) as $i ) {
my_potentially_slow_function( $i );
do_action( 'qm/lap', 'bar' );
}
// Stop the 'bar' timer:
do_action( 'qm/stop', 'bar' );Here's what the Timing panel looks like:
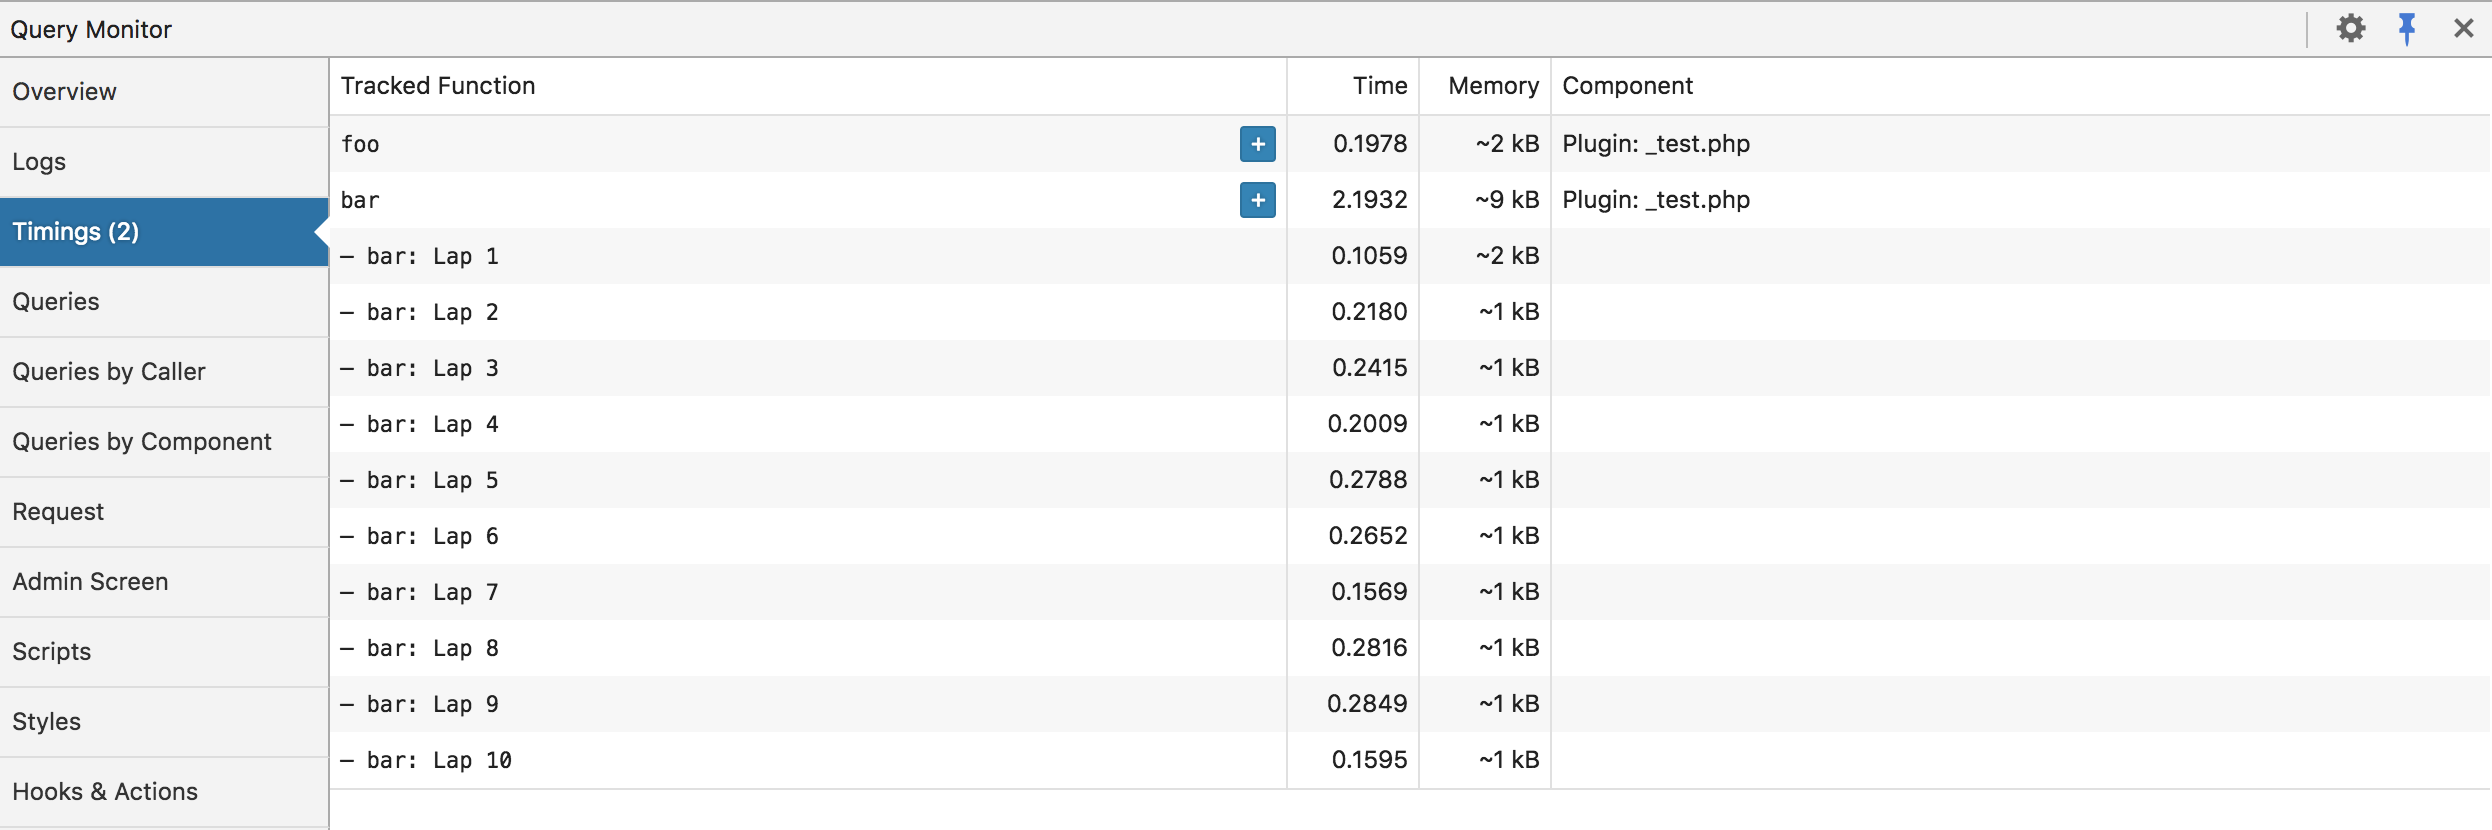
Note that the times and memory usage displayed in the Timings panel should be treated as approximations, because they are recorded at the PHP level and can be skewed by your environment and by other code. If you require highly accurate timings, you'll need to use a low level profiling tool such as XHProf.
Logging
Messages and variables can be logged in Query Monitor similarly to how you can call console.log in JavaScript to log data from WordPress to the console. This can be used as a replacement for var_dump().
do_action( 'qm/debug', 'This happened!' );do_action( 'qm/debug', 'This happened!' );You can use any of the following actions which correspond to PSR-3 and syslog log levels:
qm/debugqm/infoqm/noticeqm/warningqm/errorqm/criticalqm/alertqm/emergency
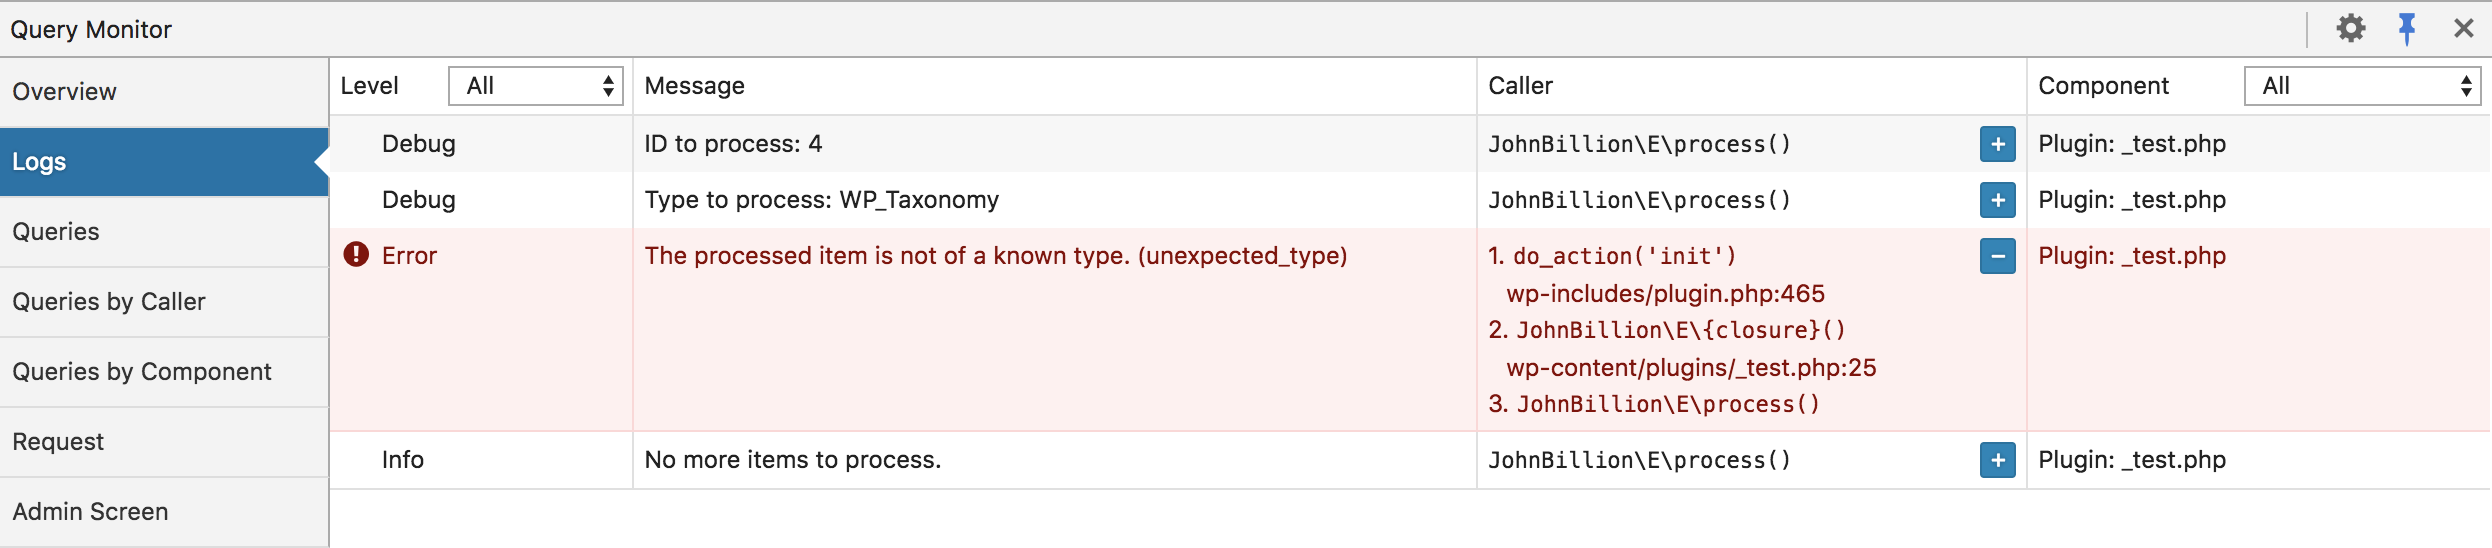
A log level of warning or higher will trigger a notification in Query Monitor's admin toolbar.
Here's what the Logs panel looks like:
Contextual interpolation can be used via the curly brace syntax:
do_action( 'qm/warning', 'Unexpected value of {foo} encountered', [
    'foo' => $foo,
] );do_action( 'qm/warning', 'Unexpected value of {foo} encountered', [
'foo' => $foo,
] );A WP_Error, Exception, or Throwable object can be passed directly into the logger:
if ( is_wp_error( $response ) ) {
    do_action( 'qm/error', $response );
}
if ( is_wp_error( $response ) ) {
do_action( 'qm/error', $response );
}try {
// your code
} catch ( Exception $e ) {
do_action( 'qm/error', $e );
}try {
// your code
} catch ( Exception $e ) {
do_action( 'qm/error', $e );
}Variables of any type can be logged and they'll be formatted appropriately:
WARNING
Be careful not to log very large values such as an array of post objects or the raw response from an HTTP request. If you really need to debug the value of something large, use a tool such as step debugging in Xdebug or debugging in Ray.
$var = [ 1, 2, 3 ];
do_action( 'qm/debug', $var );
$var = [ 1, 2, 3 ];
do_action( 'qm/debug', $var );Finally, the static logging methods on the QM class can be used instead of calling do_action():
QM::error( 'Everything is broken' );QM::error( 'Everything is broken' );The QM class is PSR-3 compatible, although it doesn't actually implement Psr\Log\LoggerInterface.
Assertions
New
New in Query Monitor 3.15
Query Monitor allows developers to perform assertions which will log an error in the Logs panel in Query Monitor when they fail. Read more about using assertions in Query Monitor.